


India’s Millionaire Boom: Rising Wealth, Old Habits
Updated: Jul 23
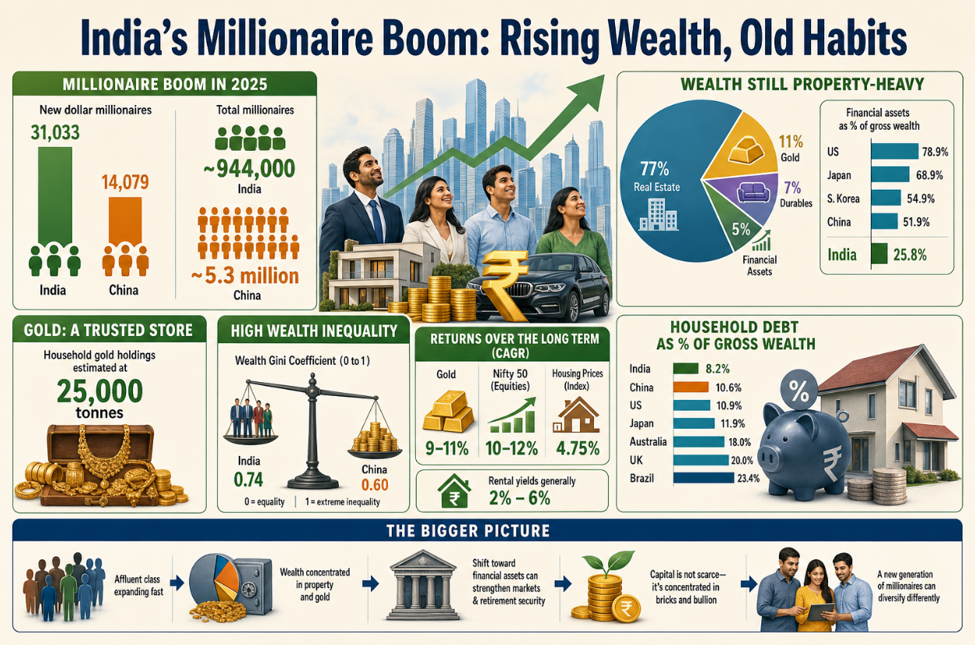
India added 31,033 new dollar millionaires in 2025, outpacing China.
Total Indian millionaires near 944,000; wealth still property-heavy.
Only 25.8% of wealth in financial assets vs 78.9% in the US.
Household gold holdings estimated at 25,000 tonnes.
Wealth inequality remains high with Gini at 0.74.
India’s affluent class is expanding at a striking pace. The UBS Global Wealth Report 2026 shows that 31,033 Indians entered the ranks of US-dollar millionaires in 2025 — more than double the 14,079 added in mainland China during the same year. While China’s millionaire population remains far larger overall, India’s faster growth rate of 3.4% compared with China’s 0.3% signals a notable shift in momentum.
Even so, the structure of Indian wealth tells a different story — one that policymakers are likely to scrutinise closely.
India vs the World
UBS calculates wealth as financial assets plus real assets, primarily housing, minus debt. By that measure, just 25.8% of India’s gross personal wealth is held in financial instruments. In contrast, financial assets account for 78.9% of wealth in the United States, 68.9% in Japan, 54.9% in South Korea and 51.9% in China. India sits near the bottom globally on this metric.
China still commands a much broader millionaire base, with more than 5.3 million dollar millionaires compared to India’s roughly 944,000. The United States remains unmatched with over 23.6 million. However, in 2025, India generated more new millionaires than several major economies, including China, Russia, Germany, Italy and South Korea.
UBS notes that changes in its methodology caution against direct year-on-year comparisons. In 2024, the US created 379,000 new millionaires — over 1,000 per day — while China added 141,000 and India about 39,000.
Parallel data from the Hurun India Wealth Report 2025 echoes the growth narrative. It estimates 871,700 millionaire families in India, up sharply from 458,000 in 2021 and 159,900 in 2017. Wealth remains concentrated in metropolitan hubs: Mumbai leads with 142,000 millionaire families, followed by New Delhi at 68,200 and Bengaluru at 31,600.
Property and Gold: The Indian Preference
Where India diverges sharply from Western economies is in asset allocation. Indian households have traditionally favoured tangible assets. An RBI-linked study found that 77% of household assets are parked in real estate, 11% in gold, 7% in durable goods and only 5% in financial products.
The World Gold Council estimates that Indian households collectively hold around 25,000 tonnes of gold. Beyond investment, gold serves as a cultural asset — gifted at weddings, pledged during emergencies and valued as a perceived inflation hedge.
Although equity investing has broadened through systematic investment plans (SIPs), mutual funds and increased demat account penetration, the transition toward financialisation remains gradual. In FY24, household net financial savings stood at 5.3% of GDP, while savings directed into physical assets reached 13.5%.
Returns and Trade-offs
National housing price data indicates moderate long-term appreciation. According to National Housing Bank figures, India’s housing price index grew at a compound annual rate of 4.75% between Q2 2013 and Q3 2024. Rental yields have generally hovered between 2% and 6%.
Gold delivered stronger gains, compounding roughly 9–11% annually over the past decade, with prices surging further during 2025–26. Yet equities have historically outperformed over extended periods. The Nifty 50 has delivered low double-digit total returns, while midcap indices have performed even better.
While select prime properties may have generated outsized gains, portfolios heavily skewed toward real estate have often underperformed diversified financial investments.
India’s household debt stands at 8.2% of gross wealth — lower than China (10.6%), the US (10.9%), Japan (11.9%), Australia (18%), the UK (20%) and Brazil (23.4%). Though low leverage appears reassuring, when combined with limited financial asset exposure, it reflects wealth that is concentrated and relatively illiquid.
Inequality and the Bigger Picture
UBS estimates India’s wealth Gini coefficient at 0.74 — close to the US level of 0.77 and significantly above China’s 0.60. On a scale where 0 indicates perfect equality and 1 signals extreme concentration, India’s reading underscores substantial wealth disparity.
Still, median wealth in India has risen approximately 20% since 2020, placing the country among a handful of markets where typical household wealth has grown meaningfully while several others experienced declines.
For policymakers, the message is clear. A broader shift toward financial assets could strengthen capital markets, improve retirement preparedness and reduce overreliance on property. Capital is not scarce in India — it is simply concentrated in bricks and bullion.
Whether India’s new generation of millionaires chooses to diversify differently from previous cohorts may shape the country’s financial evolution in the years ahead.


Comments