
India ranking in the Global Innovation Index 2025
- InduQin
- Oct 16, 2025
- 3 min read
Updated: Oct 17, 2025
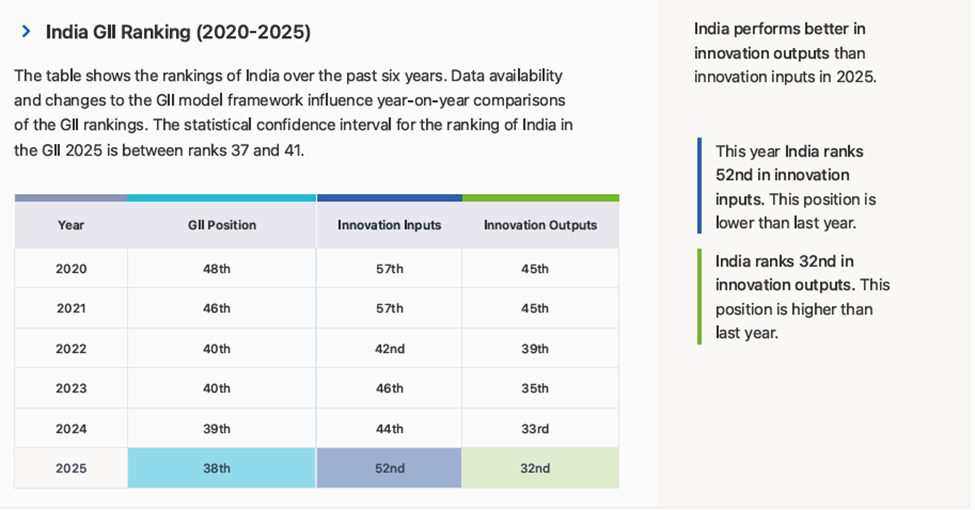
India's ranking in the Global Innovation Index (GII) 2025 showcases its strong innovation ecosystem, with four clusters among the world's top innovation hubs. The GII highlights India's advancements in technology adoption, science investment, and socioeconomic impact. Despite notable strengths in innovation outputs, challenges remain in translating investments into high-quality results. India excels in biotech, semiconductors, and corporate R&D, with its universities and unicorn companies contributing significantly to its performance.
Courtesy: The World Intellectual Property Organization (WIPO)

India has 4 clusters in the world's top innovation clusters of the Global Innovation Index.
Global Innovation Tracker
The Global Innovation Tracker 2025 shows what is the current state of innovation in India,
how rapidly is technology being embraced and what are the resulting societal impacts.

Science and innovation investment

Technology adoption
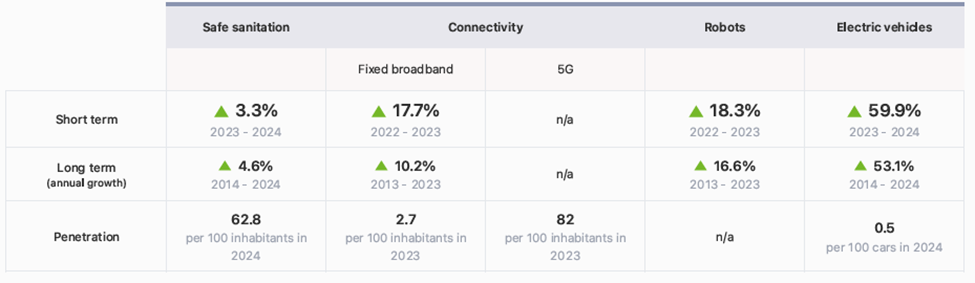
Socioeconomic impact

Notes: Not all indicators of the Global Innovation Tracker are used to calculate the Global Innovation Index. Long-term annual growth refers to the compound annual growth rate (CAGR) over the indicated period. For each variable, a one-year growth rate is set for the short run, and ten-year CAGR is set for the long run; time windows might differ when gaps exist in data availability. The end period corresponds to the most recent available observation, which may differ among countries. Temperature change is an exception: it indicates the change in degrees Celsius with respect to the average temperature in the countries. from 1951–1980. Figures are rounded.
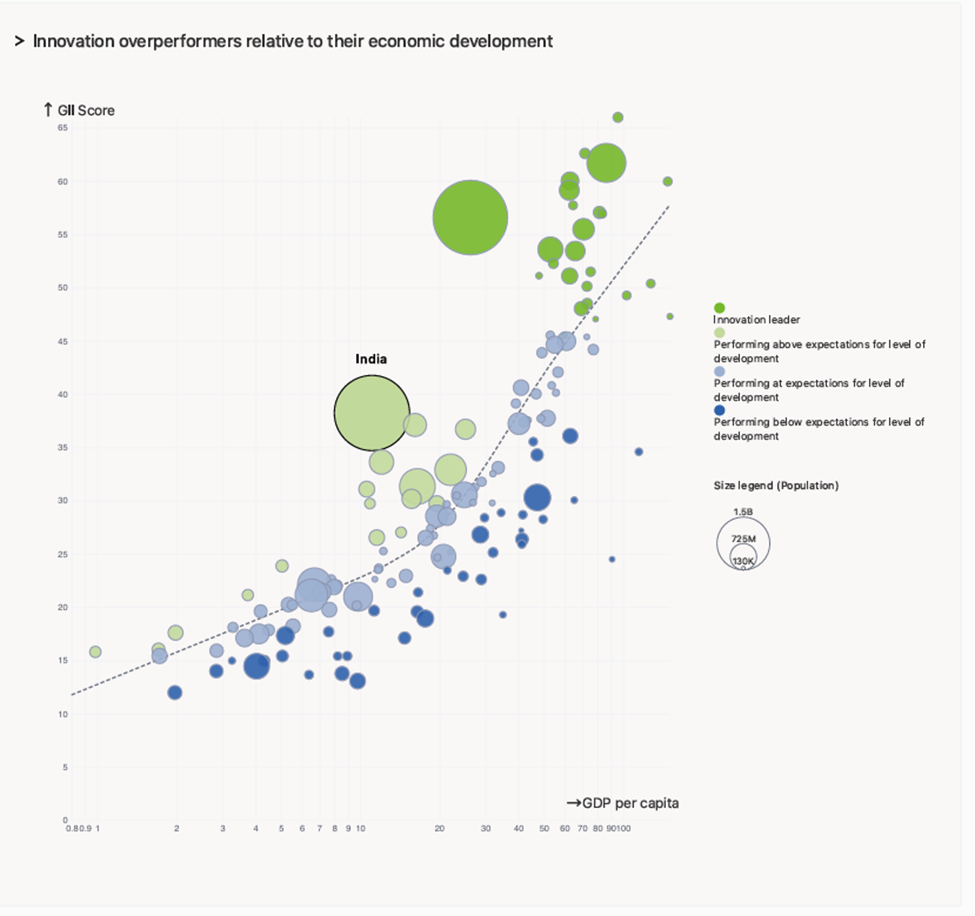
Expected vs. Observed Innovation Performance
The bubble chart below shows the relationship between income levels (GDP per capita) and innovation performance (GII score). The trend line gives an indication of the expected innovation performance according to income level. Economies appearing above the trend line are performing better than expected and those below are performing below expectations.

Effectively translating innovation investments into innovation outputs
The chart below shows the relationship between innovation inputs and innovation outputs. Economies above the line are effectively translating costly innovation investments into more and higher-quality outputs.


Overview of Indiaʼs rankings in the seven areas of the GII in 2025
The chart shows the ranking for each of the seven areas that the GII comprises. The strongest areas for India are those that rank above the GII (shown in blue) and the weakest are those that rank below.

Benchmark of India against other economy groupings for each of the seven areas of the GII Index
The charts shows the relative position of India (blue bar) against other economy groupings (grey bars)


Innovation strengths and weaknesses in India
The table below gives an overview of the indicator strengths and weaknesses of India in the GII 2025.


India's innovation system
As far as practicable, the plots below present unscaled indicator data.
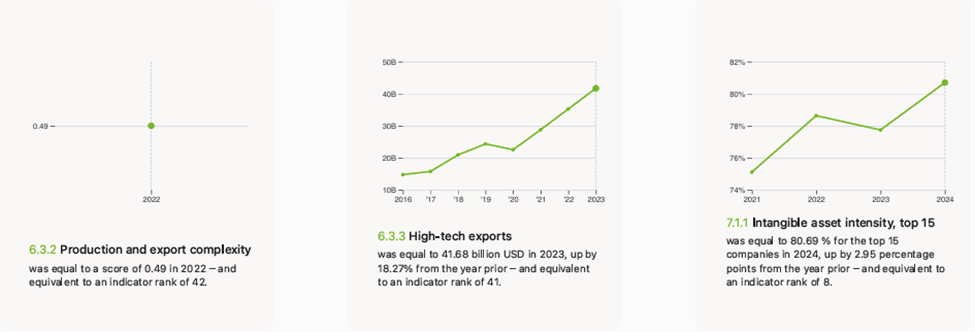
Innovation inputs in India


Innovation outputs in India


India's innovation top performers
Disclaimer: This section contains only the top performers per country. For the complete list, please visit the GII Innovation Ecosystems and Data Explorer website.
2.3.3 Global corporate R&D investors from India

2.3.4 QS university ranking of Indiaʼs top universities

Source: QS Quacquarelli Symonds Ltd (https://www.topuniversities.com/university-rankings/world-university-rankings/2024). Note: QS Quacquarelli Symonds Ltd annually assesses over 1,200 universities across the globe and scores them between [0,100]. Ranks can represent a single value ‘xʼ, a tie 'x=' or a range 'x-y'.
5.2.3 University industry and international engagement, top 5 universities

Source: Times Higher Education (THE), World University Rankings 2025. Note: Rank corresponds to within economy ranks. The score is calculated as the average of the International Outlook score (encompassing international staff, students, and co-authorship) and the industry score (reflecting industry income and patent citations). The 2025 ranking corresponds to data from the academic year that ended in 2022.
6.2.2 Top Unicorn Companies in India

Source: CBInsights, Tracker – The Complete List of Unicorn Companies: https://www.cbinsights.com/research-unicorn companies.
7.1.1 Top 15 intangible-asset intensive companies in India

Source: Brand Finance (https://brandirectory.com/reports/gift-2024). Note: Brand Finance only provides within economy ranks.
7.1.3 Top 5,000 companies in India with highest global brand value
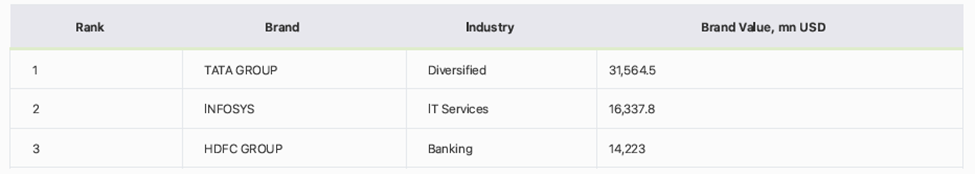
Source: Brand Finance (https://brandirectory.com). Note: Rank corresponds to within economy ranks

Data Availability
The following tables list indicators that are either missing or outdated for India.

Missing data for India

Outdated data for India

Top innovation clusters in India

The table and map below give an overview of the top innovation clusters in India.

The table and map below give an overview by intensity of the top innovation clusters in India.

About the Global Innovation Index


Comments